Paper Title: Observation of structure in the -pair mass spectrum
Authors: LHCb Collaboration
Reference: https://arxiv.org/pdf/2006.16957.pdf
My (artistic) rendition of a tetraquark. The blue and orange balls represent charm and anticharm quarks with gluons connecting all of them.
The Announcement
The LHCb collaboration reports a 5-sigma resonance at 6.9 GeV, consistent with predictions of a fully-charmed tetraquark state.
The Background
One of the ways quarks interact with each other is the strong nuclear force. This force is unlike the electroweak or gravitational forces in that the interaction strength increases with the separation between quarks, until it sharply falls off at roughly m. We say that the strong force is “confined” due to this sharp drop off. It is also dissimilar to the other forces in that the Strong force is non-perturbative. For perturbation theory to work well, the more complex a Feynman diagram becomes, the less it should contribute to the process. In the strong interaction though, each successive diagram contributes more than the previous one. Despite these challenges, physicists have still made sense organizing the zoo of quarks and bound states that come from particle collisions.
The quark () model [1,2] classifies hadrons into Mesons () and Baryons ( or ). It also allows for the existence of exotic hadrons like the tetraquark () or pentaquark (). The first evidence for an exotic hardon of this nature came in 2003 from the Belle Collaboration [1]. According to the LHCb collaboration, “all hadrons observed to date, including those of exotic nature, contain at most two heavy charm () or bottom () quarks, whereas many QCD-motivated phenomenological models also predict the existence of states consisting of four heavy quarks.” In this paper, the LHCb reports evidence of a state, the first fully charmed tetraquark state.
The Method
Perhaps the simplest way to form a fully charmed tetraquark state, from now on, is to form two charmonium states () which then themselves form a bound state. This search focuses on pairs of charmonium that are produced from two separate interactions, as opposed to resonant production through a single interaction. This is advantageous because “the distribution of any di- observable can be constructed using the kinematics from single production.” In other words, independent production reduces the amount of work it takes to construct observables.
Once is formed, the most useful decay it undergoes is into pairs of muons with about a 6% branching ratio [2]. To form candidates, the di-muon invariant mass must be between GeV. To form a di- candidate, the , all four muons are required to have originated from the same proton-proton collision point. This eliminates the possibility of associating two s from two different proton collisions.
The Findings
When the dust settles, the LHCb finds a resonance at MeV with a width of MeV. This resonance is just above twice the mass.
This post is intended to give an overview of the motivation, purpose, and discovery of the charm quark.
The Problem
The conventional 3-quark (up, down, and strange) models of the weak interaction are inconsistent with weak selection rules. In particular, strangeness-changing processes as seen in neutral Kaon oscillation [1]. These processes should be smaller than the predictions obtained from the conventional 3-quark theory. There are two diagrams that contribute to neutral kaon oscillation [2].
Neutral Kaon Oscillation
In a 3-quark model, the fermion propagators can only be up quark propagators, they both give a positive contribution to the process, and it seems as though we are stuck with these oscillations. It would be nice if we could somehow suppress these diagrams.
Solution
Introduce another up-type quark and one new quantum number called “Charm,” designed to counteract the effects of “Strangeness” carried by the strange quark. With some insight from the future, we will call this new up-type quark the charm quark.
Now, in our 4-quark model (up, down, strange, and charm), we have up and charm quark propagators a cancellation can in-principle occur. First proposed by Glashow, Iliopoulos, and Maiani, this mechanism would later become known as the “GIM Mechanism” [3]. The result is a suppression of these processes which is exactly what we need to make the theory consistent with experiments.
Experimental Evidence
Amusingly, two different experiments reported the same resonance at nearly the same time. In 1974, both the Stanford Linear Accelerator [4] and the Brookhaven National Lab [5] both reported a resonance at 3.1 GeV. SLAC named this particle the , and Brookhaven named it the and thus the particle was born. It turns out that the resonance they detected was “Charmonium,” a bound state of .
References
[1] – Report on Long Lived K0. This paper experimentally confirms neutral Kaons oscillation.
[2] – Kaon Physics. This powerpoint contains the picture of neutral Kaon oscillation that I used.
In my previous post, we discussed the features of dark matter freeze-out. The freeze-out scenario is the standard production mechanism for dark matter. There is another closely related mechanism though, the freeze-in scenario. This mechanism achieves the same results as freeze-out, but in a different way. Here are the ingredients we need, and the steps to make dark matter according to the freeze-in recipe [1].
Ingredients
Standard Model particles that will serve as a thermal bath, we will call these “bath particles.”
Dark matter (DM).
A bath-DM coupling term in your Lagrangian.
Steps
Pre-heat your early universe to temperature T. This temperature should be much greater than the dark matter mass.
Add in your bath particles and allow them to reach thermal equilibrium. This will ensure that the bath has enough energy to produce DM once we begin the next step.
Starting at zero, increase the bath-DM coupling such that DM production is very slow. The goal is to produce the correct amount of dark matter after letting the universe cool. If the coupling is too small, we won’t produce enough. If the coupling is too high, we will end up making too much dark matter. We want to make just enough to match the observed amount today.
Slowly decrease the temperature of the universe while monitoring the DM production rate. This step is analogous to allowing the universe to expand. At temperatures lower than the dark matter mass, the bath no longer has enough energy to produce dark matter. At this point, the amount of dark matter has “frozen-in,” there are no other ways to produce more dark matter.
Allow your universe to cool to 3 Kelvin and enjoy. If all went well, we should have a universe at the present-day temperature, 3 Kelvin, with the correct density of dark matter, (0.2-0.6) GeV/cm^3 [2].
This process is schematically outlined in the figure below, adapted from [1].
Schematic comparison of the freeze-in (dashed) and freeze-out (solid) scenarios.
On the horizontal axis we have the ratio of dark matter mass to temperature. Earlier times are to the left and later times are to the right. On the vertical axis is the dark matter number-density per entropy-density. This quantity automatically scales the number-density to account for cooling effects as the universe expands. The solid black line is the amount of dark matter that remains in thermal equilibrium with the bath. For the freeze-out recipe, the universe started out with a large population of dark matter that was in thermal equilibrium with the bath. In the freeze-in recipe, the universe starts with little to no dark matter and it never reaches thermal equilibrium with the bath. The dashed (solid) colored lines are dark matter abundances in the freeze-in (out) scenarios. Observe that in the freeze-in scenario, the amount of dark matter increases as temperature decreases. In the freeze-out scenario, the amount of dark matter decreases as temperature decreases. Finally, the arrows indicate the effect of increasing the X-bath coupling. For freeze in, increasing this interaction leads to more dark matter but in freeze-out, increasing this coupling leads to less dark matter.
In the universe, today, there exists some non-zero amount of dark matter. How did it get here? Has this same amount always been here? Did it start out as more or less earlier in the universe? The so-called “freeze out” scenario is one explanation for how the amount of dark matter we see today came to be.
The freeze out scenario essentially says that there is some large amount of dark matter in the early universe that decreases to the amount we observe today. This early universe dark matter is in thermal equilibrum with the particle bath , meaning that whatever particle processes create and destroy dark matter, they happen at equal rates, , so that the net amount of dark matter is unchanged. We will take this as our “initial condition” and evolve it by letting the universe expand. For pedagogical reasons, we will name processes that create dark matter “production” processes, and processes that destroy dark matter “annihilation” processes.
Now that we’ve established our initial condition, a large amount of dark matter in thermal equilibrium with the particle bath, let us evolve it by letting the universe expand. As the universe expands, two things happen:
The energy scale of the particle bath decreases. The expansion of the universe also cools down the particle bath. At energy scales (temperatures) less than the dark matter mass, the production reaction becomes kinematically forbidden. This is because the initial bath particles simply don’t have enough energy to produce dark matter. The annihilation process though is unaffected, it only requires that dark matter find itself to annihilate. The net effect is that as the universe cools, dark matter production slows down and eventually stops.
Dark matter annihilations cease. Due to the expansion of the universe, dark matter particles become increasingly separated in space which makes it harder for them to find each other and annihilate. The result is that as the universe expands, dark matter annihilations eventually cease.
Putting all of this together, we obtain the following plot, adapted from The Early Universe by Kolb and Turner and color-coded by me.
Fig 1: Color – coded freeze out scenario. The solid line is the density of dark matter that remains in thermal equilibrium as the universe expands. The dashed lines represent the freeze out density. The red region corresponds to a time in the universe when the production and annihilation rate are equal. The purple region; a time when the production rate is smaller than the annihilation rate. The blue region; a time when the annihilation rate is overwhelmed by the expansion of the universe.
On the horizontal axis is the dark matter mass divided by temperature . It is often more useful to parametrize the evolution of the universe as a function of temperature rather than time, through the two are directly related.
On the vertical axis is the co-moving dark matter number density, which is the number of dark matter particles inside an expanding volume as opposed to a stationary volume. The comoving number density is useful because it accounts for the expansion of the universe.
The quantity is the rate at which dark matter annihilates. If the annihilation rate is small, then dark matter does not annihilate very often, and we are left with more. If we increase the annihilation rate, then dark matter annihilates more frequently, and we are ultimately left with less of it.
The solid black line is the comoving dark matter density that remains in thermal equilibrium, where the production and annihilation rates are equal. This line falls because as the universe cools, the production rate decreases.
The dashed lines are the “frozen out” dark matter densities that result from the cooling and expansion of the universe. The comvoing density flattens off because the universe is expanding faster than dark matter can annihilate with itself.
The red region represents the hot, early universe where the production and annihilation rates are equal. Recall that the net effect is the amount of dark matter remains constant, so the comoving density remains constant. As the universe begins to expand and cool, we transition into the purple region. This region is dominated by temperature effects, since as the universe cools the production rate begins to fall and so the amount of dark matter than can remain in thermal equilibrium also falls. Finally, we transition to the blue region, where expansion dominate. In this region, dark matter particles can no longer find each other and annihilations cease. The comoving density is said to have “frozen out” because i) the universe is not energetic enough to produce new dark matter and ii) the universe is expanding faster than dark matter can annihilate with itself. Thus, we are left with a non-zero amount of dark matter than persists as the universe continues to evolve in time.
References
[1] – This plot is figure 5.1 of Kolb and Turners book The Early Universe (ISBN: 978-0201626742). There are many other plots that communicate essentially the same information, but are much more cluttered.
[2] – Dark Matter Genesis. This is a PhD thesis that does a good job of summarizing the history of dark matter and explaining how the freeze out mechanism works.
Protons and neutrons at first glance seem like simple objects. They have well defined spin and electric charge, and we even know their quark compositions. Protons are composed of two up quarks and one down quark and for neutrons, two downs and one up. Further, if a proton is moving, it carries momentum, but how is this momentum distributed between its constituent quarks? In this post, we will see that most of the momentum of the proton is in fact not carried by its constituent quarks.
Before we start, we need to have a small discussion about isospin. This will let us immediately write down the results we need later. Isospin is a quantum number that in practice, allows us to package particles together. Protons and neutrons form an isospin doublet, which means they come in the same mathematical package. The proton is the isospin +1/2 component of this package, and the neutron is the isospin -1/2 component of this package. Similarly, up quarks and down quarks form their own isospin doublet, and they come in their own package. In our experiment, if we are careful to choose which particles to scatter off of eachother, our calculations will permit us to exchange components of isospin packages everywhere instead of redoing calculations from scratch. This exchange is what I will call the “isospin trick.” It turns out that if compare electron-proton scattering to electron-neutron scattering allows us to use this trick:
Back to protons and neutrons. We know that protons and neutrons are composite particles, they themselves are made up of more fundamental objects. We need a way to “zoom into” these composite particles, to look inside them and we do this with the help of structure functions. Structure functions for the proton and neutron encode how electric charge and momentum are distributed between the constituents. We assign and to be the probability of finding an up or down quark with momentum fraction of the proton. Explicitly, these structure functions look like:
where the first line is the definition of a structure function. In this line, denotes quarks, and is the electric charge of quark . In the second line, we have written out explicitly the structure function for the proton , and invoked the isospin trick to immediately write down the structure function for the neutron in the third line. Observe that if we had attempted to write down following the definition in line 1, we would have gotten the same thing as the proton.
At this point we must turn to experiment to determine and . The plot we will examine [1] is figure 17.6 taken from section 17.4 of Peskin and Schroeder, An Introduction to Quantum Field Theory. Some data is omitted to illustrate a point.
The momentum distribution of the quarks inside the proton. Some data has been omitted for the purposes of this discussion. The full plot is provided at the end of this post.
This plot shows the momentum distribution of the up and down quarks inside a proton. On the horizontal axis is the momentum fraction and on the vertical axis is probability. The two curves represent the probability distribution of the up (u) and down (d) quarks inside the proton. Integrating these curves gives us the total percent of momentum stored in the up and down quarks which I will call uppercase and uppercase . We want to know know both and , so we need another equation to solve this system. Luckily we can repeat this experiment using neutrons instead of protons, obtain a similar set of curves, and integrate them to obtain the following system of equations:
Solving this system for and yields and . We immediately see that the total momentum carried by the up and down quarks is of the momentum of the proton. Said a different way, the three quarks that make up the proton, only carry half ot its momentum. One possible conclusion is that the proton has more “stuff” inside of it that is storing the remaining momentum. It turns out that this additional “stuff” are gluons, the mediators of the strong force. If we include gluons (and anti-quarks) in the momentum distribution, we can see that at low momentum fraction , most of the proton momentum is stored in gluons. Throughout this discussion, we have neglected anti-quarks because even at low momentum fractions, they are sub-dominant to gluons. The full plot as seen in Peskin and Schroeder is provided below for completeness.
References
[1] – Peskin and Schroeder, An Introduction to Quantum Field Theory, Section 17.4, figure 17.6.
[B] – Fundamentals in Nuclear Theory, Ch3. This is a more technical treatment of isospin, roughly at the level of undergraduate advanced quantum mechanics.
In a recent paper [1], Chris Karwin et al. report an excess in gamma rays that seem to be originating from our nearest galaxy Andromeda. The amount of excess is arguably insignificant, roughly 3% – 5%. However, the spatial location of this excess is what is interesting. The luminous region of Andromeda is roughly 70 Kpc in diameter [2], but the gamma ray excess is located roughly 120 – 200 Kpc from the center. Below is an approximately-to-scale diagram that illustrates the spatial extent of the excess:
Pictorial representation of the spatial extent of the gamma ray excess from Andromeda.
There may be many possible explanations and interpretations for this excess, one of the more exotic possibilities is dark matter annihilations. The dark matter paradigm says that galaxies form within “dark matter halos,” a cloud of dark matter that attracts luminous matter that will eventually form a galaxy [3]. The dark matter halo encompassing Andromeda has a virial radius of about 200 Kpc [4], well beyond the location of the gamma ray excess. This means that there is dark matter at the location of the excess, but how do we start with dark matter and end up with photons?
Within the “light mediator” paradigm of dark matter particle physics, dark matter can annihilate with itself into massive dark photons, the dark matter equivalent of the photon. These dark photons by ansatz, can interact with standard model and ultimately decay into photons. A schematic diagram of this process is provided below:
Dark matter (X) annihilates into dark photons (A) which couple to Standard Model particles that eventually decay into photons.
To recap,
There is an excess of high energy, 1-100 GeV photons from Andromeda.
The location of this excess is displaced from the luminous matter within Andromeda.
This spatial displacement means that the cause of this excess is probably not the luminous matter within Andromeda.
We do know however, that there is dark matter at the location of the excess.
It is possible for dark matter to yield high energy photons so this excess may be evidence of dark matter.
Why should we even care about neutrinos coming from the sun in the first place? In the 1960’s, the processes governing the interior of the sun were not well understood. There was a strong suspicion that the suns main energy source was the fusion of Hydrogen into Helium, but there was no direct evidence for this hypothesis. This is because the photons produced in fusion processes have a mean free path of about 10^(-10) times the radius of the sun [1]. That is to say, it takes thousands of years for the light produced inside the core of the sun to escape and be detected at Earth. Photons then are not a good experimental observable to use if we want to understand the interior of the sun.
Additionally, these fusion processes also produce neutrinos, which are essentially non-interacting. Their non-interactive properties on one hand means that they can escape the interior of the sun unimpeded. Neutrinos thus give us a direct probe into the core of the sun without the wait that photons require. On the other hand though, these same non-interactive properties mean that detecting them is extremely difficult.
The undertaking to understand and measure these neutrinos was headed by John Bahcall, who headed the theoretical development, and Ray Davis Jr, who headed the experimental development.
In 1963, John Bahcall gave the first prediction of the neutrino flux coming from the sun [1]. Five years later in 1968, Ray Davis provided the first measurement of the solar neutrino flux [2]. They found that the predicted value was about 2.5 times higher than the measured value. This discrepancy is what became known as the solar neutrino problem.
This plot shows the discrepancy between the measured (blue) and predicted (not blue) amounts of electron neutrinos from various experiments. Blue corresponds to experimental measurements. The other colors correspond to the predicted amount of neutrinos from various sources. This figure was first presented in a 2004 paper by Bahcall [3].
Broadly speaking, there were three causes for this discrepancy:
The prediction was incorrect. This was Bahcalls domain. At lowest order, this could involve some combination of two things. First, incorrect modeling of the sun resulting in inaccurate neutrino fluxes. Second, inaccurate calculation of the observable signal resulting from the neutrino interactions with the detector. Bahcall and his collaborators spent 20 years refining this work and much more but the discrepancy persisted.
The experimental measurement was incorrect. During those same 20 years, until the late 1980’s, Ray Davis’ experiment was the only active neutrino experiment [4]. He continued to improve the experimental sensitivity, but the discrepancy still persisted.
New Physics. In 1968, B. Pontecorv and V. Gribov formulated Neutrino oscillations as we know it today. They proposed that Neutrino flavor eigenstates are linear combinations of mass eigenstates [5]. At a very hand-wavy level, this ansatz sounds reasonable because a neutrino of one flavor at production can change its identity while it propagates from the Sun to the Earth. This is because it is the mass eigenstates that have well-defined time-evolution in quantum mechanics.
It turns out that Pontecorv and Gribov had found the resolution to the Solar Neutrino problem. It would take an additional 30 years for experimental verification of neutrino oscillations by Super-K in 1998 [6], and Sundbury Neutrino Observatory (SNO) in 1999 [7].
References:
[1] – Solar Neutrinos I: Theoretical This paper lays out the motivation for why we should care about solar neutrinos at all.
This post is about the discovery of the most massive quark in the Standard Model, the Top quark. Below is a “discovery plot” [1] from the Collider Detector at Fermilab collaboration (CDF). Here is the original paper.
This plot confirms the existence of the Top quark. Let’s understand how.
For each proton collision that passes certain selection conditions, the horizontal axis shows the best estimate of the Top quark mass. These selection conditions encode the particle “fingerprint” of the Top quark. Out of all possible proton collisions events, we only want to look at ones that perhaps came from Top quark decays. This subgroup of events can inform us of a best guess at the mass of the Top quark. This is what is being plotted on the x axis.
On the vertical axis are the number of these events.
The dashed distribution is the number of these events originating from the Top quark if the Top quark exists and decays this way. This could very well not be the case.
The dotted distribution is the background for these events, events that did not come from Top quark decays.
The solid distribution is the measured data.
To claim a discovery, the background (dotted) plus the signal (dashed) should equal the measured data (solid). We can run simulations for different top quark masses to give us distributions of the signal until we find one that matches the data. The inset at the top right is showing that a Top quark of mass of 175GeV best reproduces the measured data.
Taking a step back from the technicalities, the Top quark is special because it is the heaviest of all the fundamental particles. In the Standard Model, particles acquire their mass by interacting with the Higgs. Particles with more mass interact more with the Higgs. The Top mass being so heavy is an indicator that any new physics involving the Higgs may be linked to the Top quark.
[2] – Observation of tt(bar)H Production – Who is to say that the Top and the Higgs even have significant interactions to lowest order? The CMS collaboration finds evidence that they do in fact interact at “tree-level.”
This plot [1] is the first experimental evidence for the particle that would eventually be named the tau.
On the horizontal axis is the energy of the experiment. This particular experiment collided electron and positron beams. On the vertical axis is the cross section of a specific event resulting from the electron and positron beams colliding. The cross section is like a probability for a given event to occur. When two particles collide, many many things can happen, each with their own probability. The cross section for an event encodes the probability for that particular event to occur. Events with larger probability have larger cross sections and vice versa.
The collaboration found one event could not be explained by the Standard Model at the time. The event in question looks like:
This event is peculiar because the final state contains both an electron and a muon with opposite charges. In 1975, when this paper was published, there was no way to obtain this final state, from any known particles or interactions.
In order to explain this anomaly, particle physicists proposed the following explanations:
Pair production of a heavy lepton. With some insight from the future, we will call this heavy lepton the “tau.”
Pair production of charged Bosons. These charged bosons actually end up being the bosons that mediate the weak nuclear force.
The production of tau’s and these bosons are not equally likely though. Depending on the initial energy of the beams, we are more likely to produce one than the other. It turns out that at the energies of this experiment (a few GeV), it is much more likely to produce taus than to produce the bosons. We would say that the taus have a larger cross section than the bosons. From the plot, we can read off that the production of taus, their cross section, is largest at around 5 GeV of energy. Finally, since these taus are the result of pair production, they are produced in pairs. This bump at 5 GeV is the energy at which it is most likely to produce a pair of taus. This plot then predicts the tau to have a mass of about 2.5 GeV.
[2] – The Discovery of the Tau Lepton. This is a comprehensive story of the discovery of the Tau, written by Martin Perl who would go on to win the 1995 Nobel prize in Physics for its discovery.
[3] – Lepton Review. Hyperphysics provides an accessible review of the Leptonic sector of the Standard Model.


 processes as seen in neutral Kaon oscillation
  [1]. These processes should be smaller than the predictions obtained from the conventional 3-quark theory. There are two diagrams that contribute to neutral kaon oscillation [2].
 oscillations. It would be nice if we could somehow suppress these diagrams.
 , and Brookhaven named it the
  and thus the
  particle was born. It turns out that the resonance they detected was “Charmonium,” a bound state of
  .
. particle.
 is in thermal equilibrum with the particle bath
  , meaning that whatever particle processes create and destroy dark matter, they happen at equal rates,
  , so that the net amount of dark matter is unchanged. We will take this as our “initial condition” and evolve it by letting the universe expand. For pedagogical reasons, we will name processes that create dark matter
  “production” processes, and processes that destroy dark matter
  “annihilation” processes.
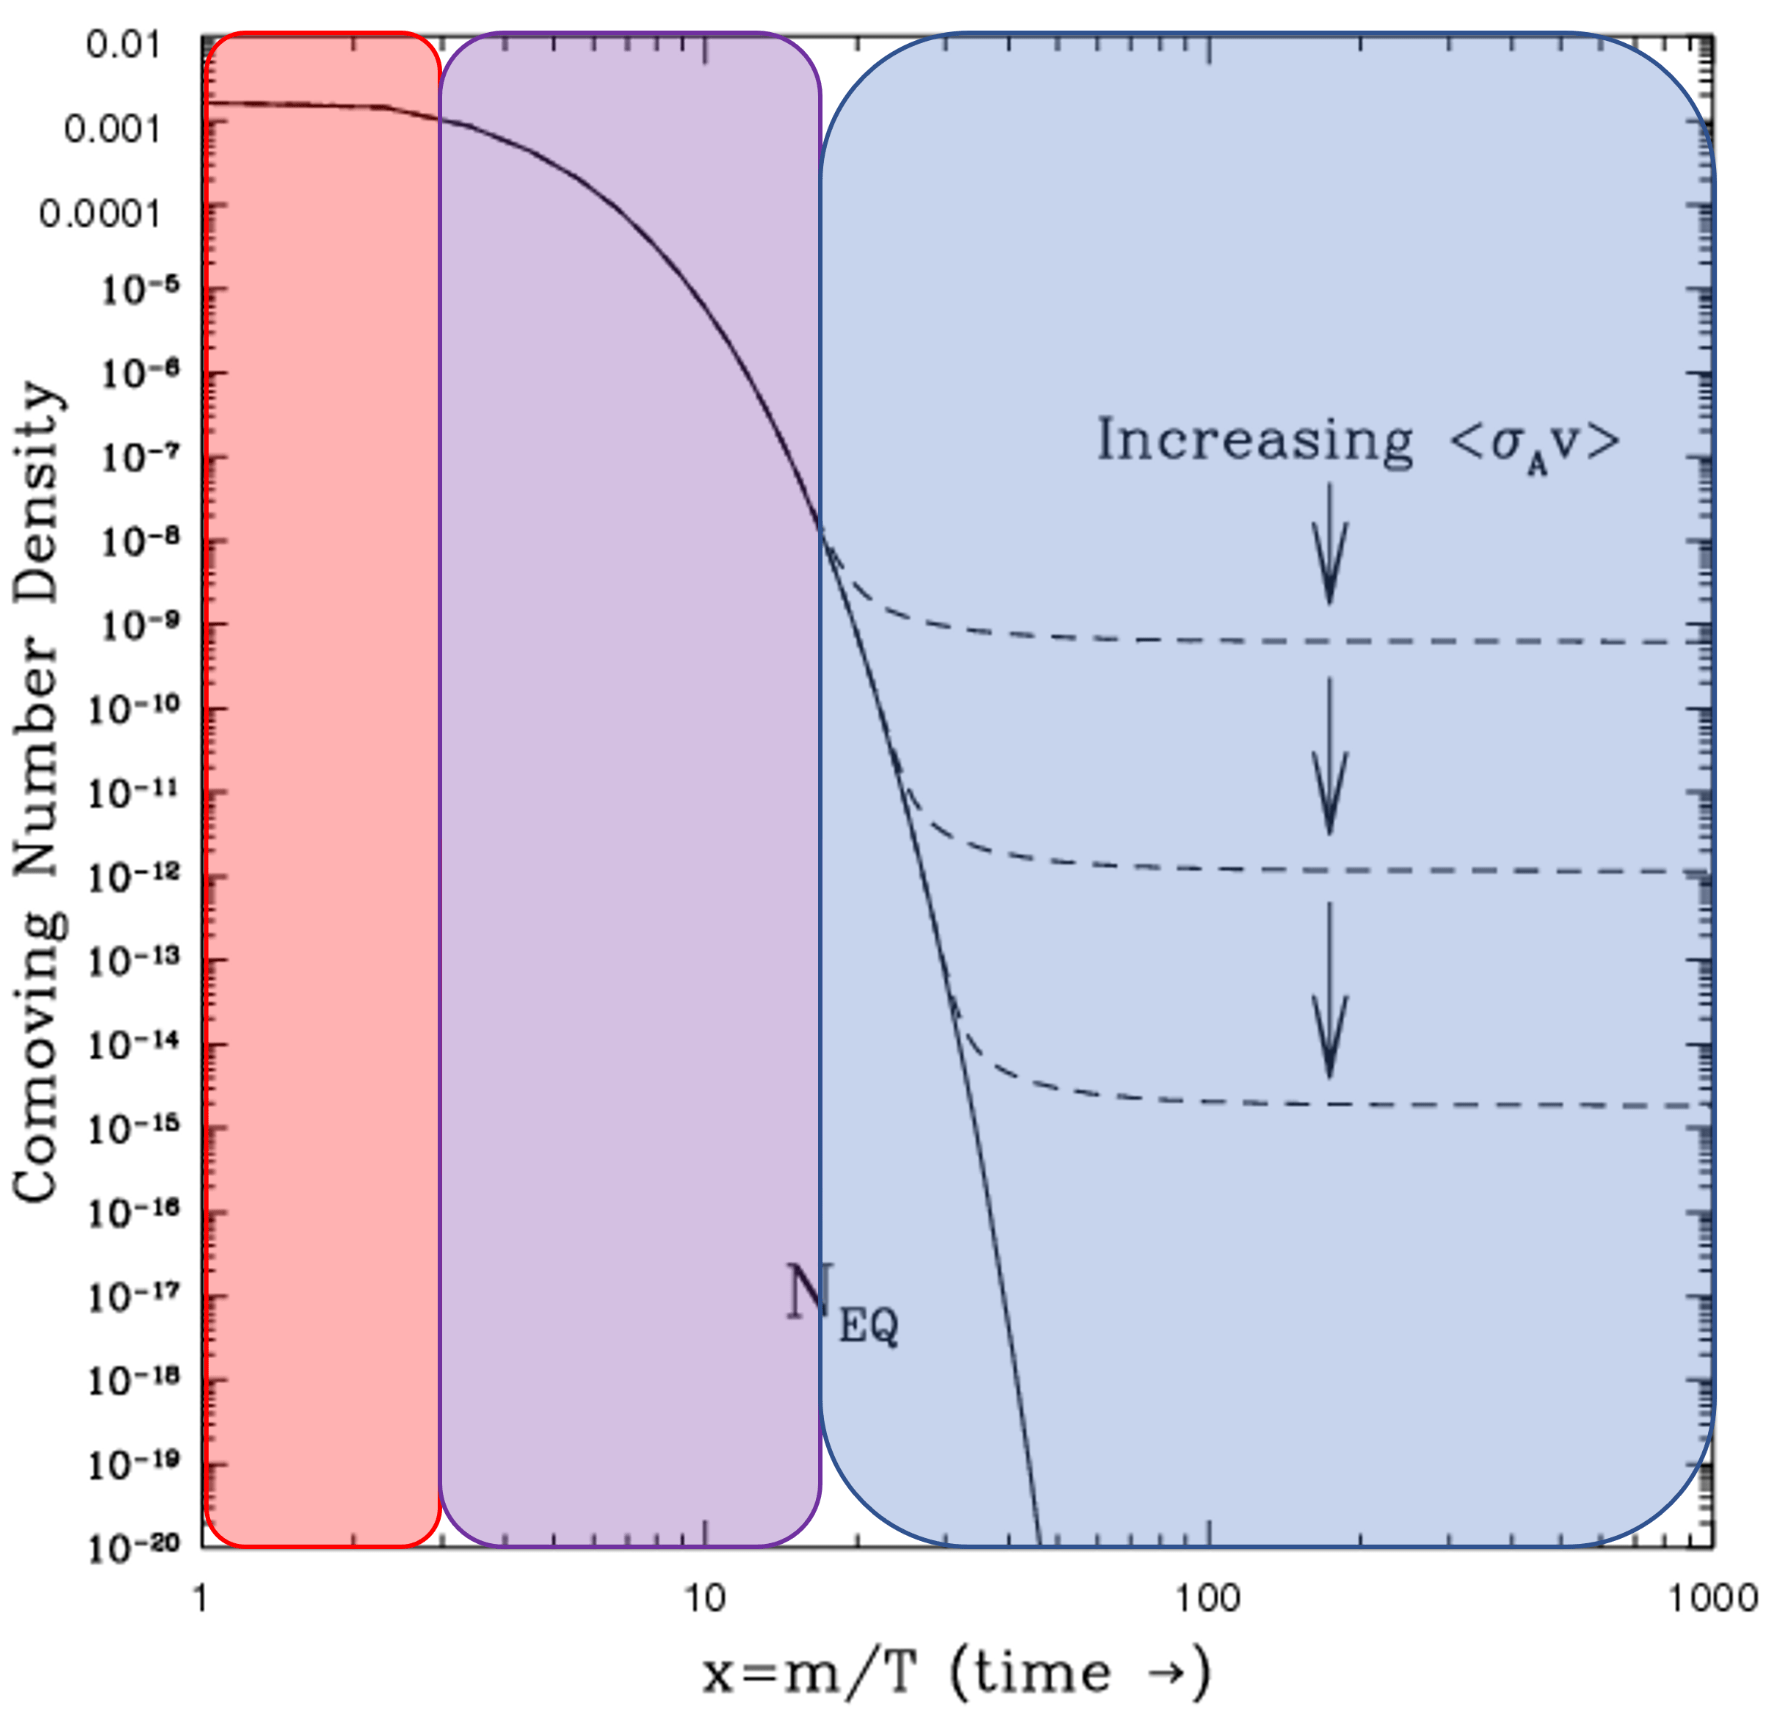
 . It is often more useful to parametrize the evolution of the universe as a function of temperature rather than time, through the two are directly related.
 is the rate at which dark matter annihilates. If the annihilation rate is small, then dark matter does not annihilate very often, and we are left with more. If we increase the annihilation rate, then dark matter annihilates more frequently, and we are ultimately left with less of it.
 . Structure functions for the proton and neutron encode how electric charge and momentum are distributed between the constituents. We assign
  and
and  to be the probability of finding an up or down quark with momentum fraction
  of the proton. Explicitly, these structure functions look like:
 is the electric charge of quark
  , and invoked the isospin trick to immediately write down the structure function for the neutron
  in the third line. Observe that if we had attempted to write down
 and uppercase
  . We want to know know both
 and
and  . We immediately see that the total momentum carried by the up and down quarks is
  of the momentum of the proton. Said a different way, the three quarks that make up the proton, only carry half ot its momentum. One possible conclusion is that the proton has more “stuff” inside of it that is storing the remaining momentum. It turns out that this additional “stuff” are gluons, the mediators of the strong force. If we include gluons (and anti-quarks) in the momentum distribution, we can see that at low momentum fraction


